
By Andy May
This is the second of seven posts on the potential costs and hazards of human-caused global warming and the impact of humans on the environment. The first post is on humans and the environment (here). The IPCC WGII AR5 Technical Summary, defines “hazards” as follows on page 39:
“The potential occurrence of a natural or human-induced physical event or trend or physical impact that may cause loss of life, injury, or other health impacts, as well as damage and loss to property, infrastructure, livelihoods, service provision, ecosystems, and environmental resources. In this report, the term hazard usually refers to climate-related physical events or trends or their physical impacts.”
The IPCC WGII AR5 report only deals with population growth tangentially, but it has a lot of information on the world’s food supply. The WGII AR5 technical summary states:
“For the major crops (wheat, rice, and maize) in tropical and temperate regions, climate change without adaptation is projected to negatively impact aggregate production for local temperature increases of 2°C or more above late-20th-century levels, although individual locations may benefit (medium confidence).”
As we will show below, there is no indication of a change in the rate of increase in crop yields in the United Nations FAO data.
They include the phrase “without adaptation” in their prediction. Since the developing world is adopting the farming technology of the developed world, especially irrigation systems, hydroponics, fertilizer and farm machinery at an accelerating rate, this is a good CYA if their predictions fail. We will also discuss the trends in human population growth.
Population Growth
Ever since Thomas Malthus published his theory of population growth in 1798 there have been large groups who believe that man will breed himself into starvation by consuming all of the Earth’s resources. We’ve had over 200 years to prove him correct, but instead today with a population of 7.2 billion, versus the 1798 population of around 800 million, we have more food per person and a smaller fraction of malnourished people than in 1798 as we will show in this essay.
As recently as 1968, Paul Ehrlich published The Population Bomb which predicted, among other things, that hundreds of millions would starve to death in the 1970s and that England would not even exist in in the year 2000. He also warned that the world as we know it will cease to exist before 1985. Well, just like Malthus, Ehrlich was comically wrong.
The world today is improving at a very rapid pace. The only way to see it otherwise is to see humans as a “plague on the Earth” (Sir David Attenborough in 2013 in an interview with Radio Times) and bad for some metaphysical god called “Gaia.” As for the idea that the human population is growing too fast, consider this:
“As you can see in Figure [1], the massive growth in the world’s population began around 1950 and will probably end around 2050. The increase in the population is mainly due to a dramatic fall in the death rate as a result of improved access to food, medicine, clean water and sanitation. The increase is not, on the other hand, due to people in developing countries having more and more children. In the early 1950s women in developing countries gave birth to an average of more than six children – compared to an average of around three today. As [UN Consultant Peter Adamson] put it, rather bluntly: “It’s not that people suddenly started breeding like rabbits; it’s just that they stopped dying like flies.” Lomborg, Bjørn. The Skeptical Environmentalist: Measuring the Real State of the World (pp. 45-46).

Figure 1 (Data source: United Nations Population Division, 2017 data and projections)
“In a traditional agricultural society, income is low and mortality high. However, children working and providing for their parents in old age generally supply greater benefits than their cost, and therefore the birth rate is high. With improved living conditions, medicine, sanitation and general economic prosperity, the death rate falls. The transition towards a more urban and developed economy makes children more likely to survive while they start to cost more than they contribute, needing more education, working less and transferring the care of their parents to nursing homes. Consequently, the birth rate drops.” Lomborg, Bjørn. The Skeptical Environmentalist: Measuring the Real State of the World (p. 46).

Figure 2 (Source: The Skeptical Environmentalist)
In figure 2 the death rate falls first and then the birth rate. In figure 3, we see the U.S. Census Bureau estimates of world population growth in absolute terms and in percent. In absolute terms the growth rate peaked in 1990 at 87 million people a year, it fell to 83 million by 2016 and the rate of population growth is currently 1.12%, down from over 2% in the early 1960s. It is expected to continue to fall and is projected to be less than 0.1% in 2100.

Figure 3 (Source: The U.S. Census, 2017 data and projections)
It is silly to blame population density for a poor quality of life, since the population density of Southeast Asia is the same as in the U.K. The problem with the quality of life in Southeast Asia is not population density, it is poverty.
As the modern industrial era began in the early 1900s, life expectancy increased quickly. Similar improvements occurred in the developing world, although they began later. By 1950 the developing world had a life expectancy of 41 years, it improved to 65 by 1998. Life expectancy has improved over all, but always correlates with income, see figure 4.

Figure 4 (Source “Our World in Data”)
“Professor David Pimentel of Cornell University is a frequently cited and well-known environmentalist, responsible – among many other arguments – for a global erosion estimate far larger than any other … and for arguing that the ideal population of a sustainable US would be 40–100 million (i.e. a reduction of 63–85 percent of the present population).” Lomborg, Bjørn. The Skeptical Environmentalist: Measuring the Real State of the World (p. 22).
According to worldhunger.org, in 1990 there were one billion malnourished people in the world (18.6%) and in 2014 there were 794 million (10.9%). A reduction in the number of malnourished, even though the total population had increased to 7.2 billion in 2014 from 5.3 billion in 1990 (36%). According to UNICEF, the number of stunted children has decreased from 254 million in 1990 to 155 million in 2016. The number of overweight children has increased from 32 million to 41 million. There is no evidence that the population needs to be decreased.
The last major attempt to decrease a population was in China, it has since been rescinded and China has dramatically reduced hunger and malnutrition by using modern technology, trade, and fossil fuels. The life expectancy at birth increased from 40 years to 70 years between 1950 and 2000. This is due to a reduction in disease and in infant mortality, as well as a decrease in malnutrition. China has decreased malnutrition from 24% in 1990 to 9% in 2016. Child malnutrition has dropped by over 70%.
The effect of global warming on our food supply
“Stories of how global warming will “greatly increase the number of hungry people” and of how we are facing “catastrophe” with “whole regions becoming unsuitable for producing food” abound.” Lomborg, Bjorn. Cool It (Kindle Locations 1549-1550).
Consider this story, from 1968, by Paul Ehrlich (The Population Bomb):
“The battle to feed humanity is over. In the course of the 1970s the world will experience starvation of tragic proportions – hundreds of millions of people will starve to death.” … Ehrlich runs down what he calls the “professional optimists”: “They say, for instance, that India in the next eight years can increase its agricultural output to feed some 120 million more people than they cannot after all feed today. To put such fantasy into perspective one need consider only …”, and Ehrlich presented a whole list of reasons why this could not be achieved. And sure enough, it turned out that the figure of 120 million did not hold water. Eight years later India produced enough food for 144 million more people. And since the population had grown by ‘only’ 104 million, this meant there was more food to go around.” Lomborg, Bjørn. The Skeptical Environmentalist: Measuring the Real State of the World (p. 60).
Dr. Craig Idso and others have collected evidence that net primary plant productivity has increased over 20% since 1961 (see here). This is in addition to additional crop productivity due to technology. Much of this growth in productivity (perhaps 70%) has been due to increasing CO2, some is due to the increase in arable land and a longer growing season due to warmer temperatures. Dr. Idso, and others, have estimated that the monetary benefit of rising CO2 on global plant production is $3.2 trillion from 1961 to 2011.
“… food availability has increased dramatically over the past four decades. The average person in the developing world has experienced a 40 percent increase in available calories. Likewise, the proportion of malnourished has dropped from 50 percent to less than 17 percent. The UN expects these positive trends to continue at least till 2050 with another 20 percentage points’ calorie increase and malnourished dropping below 3 percent.” Lomborg, Bjorn. Cool It (Kindle Locations 1552-1556).
The world now has 800 million malnourished people. This is projected to decrease to 108 million by 2080, if global warming has a negative impact, as it does in some pessimistic forecasts, there would be 136 million malnourished in 2080. This is still many fewer than we have today and in 2080, the population will be much higher than it is today, so the malnourished population, as a percent of the total population, will drop even more (Lomborg, Cool It). How many malnourished people we have is not very dependent upon climate, it is mostly a matter poverty, war and transportation of goods, especially food.
World agricultural production has more than tripled since 1961 (figure 5) and the increase is more than 4 times in developing countries (figure 6). According to the U.N. we produce 23% more food per person than in 1960 (FAO). The FAO has recently announced that cereal production has reached a new record in 2017.

Figure 5: World Agricultural Production (Source FAOSTAT)

Figure 6: Least developed country agricultural production (Source FAOSTAT)

Figure 7, Kilocalories of food per person around the world, source ourworldindata.org)
As food production rapidly increases around the world, the number of calories (technically kilocalories) each person has available (figure 7) is also increasing. Even in Africa and Asia, the available food supply has increased dramatically since 1961.
“Each time our investment in climate saves one person from hunger, a similar investment in direct hunger policies could save more than five thousand people.” Lomborg, Bjorn. Cool It (Kindle Locations 1618-1619).
I will leave it to the reader to reconcile the data and graphs above with this statement from the IPCC WGII AR5 Technical Summary on page 47:
“Based on many studies covering a wide range of regions and crops, negative impacts of climate change on crop yields have been more common than positive impacts (high confidence).”
Given the data presented in figures 5 and 6 one might think they are they saying that the effect of climate on crop yields is insignificant. It seems very likely that crop yields will continue to increase, if climate is a negative effect, it must be very small.

Figure 8, FAO Inflation corrected World food prices.
World food prices (figure 8) are up since about 2005 when biofuels, especially corn ethanol, took off (see figure 9). The production of ethanol consumes 40% of U.S. corn. The World Bank discusses the reasons for higher prices here. The article was written just after the food price peak was reached in 2012, which corresponds with the flattening of corn-based ethanol production (figure 9). The causes were mainly biofuel production, poor weather and increasing demand for grain in Asia to be used for livestock feed, as Asian consumption of poultry and meat has increased.

Figure 9, U.S. Biofuel growth (Source: eia.gov)
Prices have fallen since 2011 when they reached their peak. Biofuel production flattened in 2010 and as farms increased their production to meet demand. The increase in food production and decreasing food prices are mostly due to improving agricultural technology in the developing world. But, some of the increase is due to additional atmospheric CO2, which acts as an airborne fertilizer and to global warming, especially in Siberia and Canada, where it has opened more land to farming (see AR5, here). This has contributed to the boom in agriculture in Russia. Most of recent global warming has occurred in Canada and Siberia, which has helped farmers in those areas, see figure 10.

Figure 10, source NASA
Lomborg wrote the following in 1997 and it was true then. What he did not know at the time was that biofuels would explode onto the scene and humans would foolishly burn their food as fuel by heavily subsidizing corn and sugar ethanol. This had the obvious effect of raising food prices around the world and delaying the reduction of food poverty.
“At the same time as the Earth accommodates ever more people, who are making demands for ever more food, food prices have fallen dramatically. In 2000 food cost less than a third of its price in 1957. This fall in food prices has been vital for many people in the developing world, especially the many poverty-stricken city dwellers.” Lomborg, Bjørn. The Skeptical Environmentalist: Measuring the Real State of the World (p. 62).
“The fall in the price of food is a genuine long-term tendency. The price of wheat has had a downwards trend ever since 1800, and wheat is now more than ten times cheaper than the price charged throughout the previous 500 years.” Lomborg, Bjørn. The Skeptical Environmentalist: Measuring the Real State of the World (p. 62).
The AR5 WGII report rather inexplicably reports that the impact of climate change reduced agricultural yields 1960 to 2013, see figure TS.2E, page 43. This is at odds with yield data from the United Nations FAO (figure 11). The ourworldindata.org web site plots FAO crop yield data that shows yields increasing all over the world, not falling. Figure 11, as an example, plots total wheat yield from 146 countries from 1961 through 2014, using 2017 FAO data.
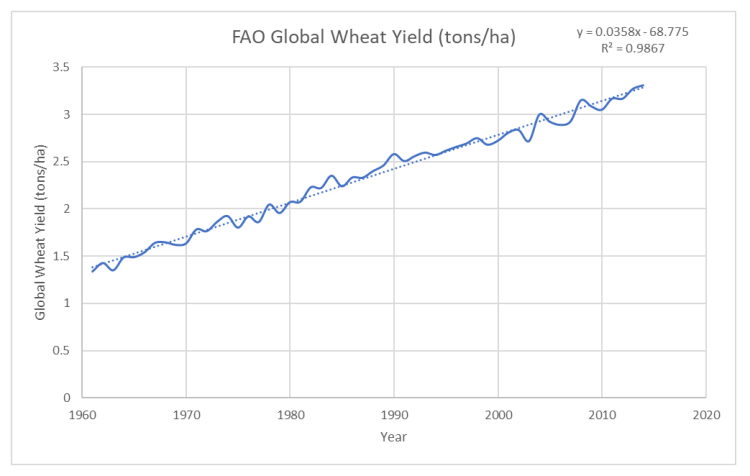
Figure 11, plot of total wheat yield from 146 countries, data from FAO (2017) and Ourworldindata.org.
Yields are increasing 2% per year from 1961 to 2014 and the observed increase is very linear. Total food production is also increasing, and the rate of increase is increasing as can be seen in figures 5 and 6. The IPCC WGII conclusions are model-based and show very tiny “negative climate caused” changes of up to 2%/decade, see figure 12, this figure is from chapter 7, page 492 of the full report.

Figure 12, source IPCC AR5 WGII, Chapter 7, page 492
The modeled 2%/decade “climate caused” decrease is not apparent in figure 11, which is actual FAO data over the nearly same period (1961-2014). The IPCC model was run on 1960-2013. AR5 explains their model results as follows:
“Based on these studies, there is medium confidence that climate trends have negatively affected wheat and maize production for many regions (Figure 7-2) (medium evidence, high agreement).”
Based on the data “medium confidence” seems to be an exaggeration. Further, spending many pages discussing their “modeled result” and not one word on the fact that yields are, in fact, increasing at a rate of 2% per year is disingenuous.
Conclusions
A Mathusian or Erhlichian food catastrophe seems highly unlikely in the foreseeable future. Food production is growing rapidly due to the spread of western farm technology, CO2 fertilization, and new arable land in Canada and Russia due to global warming. The additional food is being distributed worldwide as the number of kilocalories of food available to people worldwide is increasing dramatically.
Although IPCC models show that climate change should be decreasing crop yields, the data show no slowing of growth in yields.
Although the world population continues to increase, the number of people being added to the population each year is decreasing. In addition, the rate of population growth has been decreasing since 1963. The peak growth year in absolute numbers was 88,000,000 in 1989 and it is still decreasing. Both numbers are expected to be near zero in 2100. The growth increased due to the average life expectancy increasing, due to a falling death rate. The birth rate then began to decline as the population became more urban and children became less valuable as workers and for security in old age. That is, the cost of raising a child increased and the benefits of having children decreased. As the world becomes more prosperous and urban this trend will continue. Human prosperity is the key to a better world.

6 thoughts on “Population Growth and the food supply”